Service Manager
Viewing the Integration Status and History
The fastest way to spot errors is to look at the integration log. You can also view the status of your data import and cancel a running import.
•Viewing the Integration Queue
•Viewing the Data Integration Log - File Integration
•Viewing the Integration Log - SCCM
•Viewing Data Integration History
•Canceling a Running or Queued Job
Viewing the Integration Queue
The integration queue only shows active or running jobs. Once the import is completed or aborted, the job disappears from the list.
1.From the Configuration Console, click Extend > Integration Tools > Integration Queue to view the Integration Queue workspace.
The application displays running jobs. If there are no running jobs, the workspace is empty. The application can process multiple integration jobs at one time.
Viewing the Data Integration Log - File Integration
1.Log into the Service Manager Application.
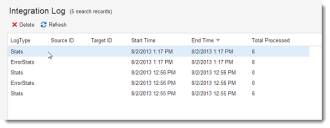
2.Open the Integration Log workspace. The list of data imports appears.
Sample Integration Log
If an import was successful, one line appears under LogType: Stats.
Errors encountered are shown with two lines: Stats and ErrorStats.
•Stats: Double-click to view a summary of the job.
•ErrorStats: Double-click to view a summary of the errors. Open the attachment to view the rows containing errors. The last column contains specific details about the error. You can modify the data (correct the errors) in the attachment file and save it to the source location for re-import. The error message will be ignored and the data will be imported into the database.
Viewing the Integration Log - SCCM
View the details of the processed job from the Integration Log workspace.
1.Log into the Service Manager Application.
2.Open the Integration Log workspace. The list of import jobs appear with the following information:
| Field | Description |
|---|---|
| Log Type |
Shows three log types: Queued: Indicates that the source ID from SCCM has been queued in the inventory management asset data processor. Verified: Indicates that the source ID from SCCM has been successfully created in the Service Manager database. Stats: Shows the statistics about the number of rows processed. |
| Source ID | SCCM root table key (Computer_System_DATA) shown on the Object Mapping page of the wizard. |
| Target ID | Asset ID that is derived from the asset identifier mapping function on the Field Mapping page of the wizard. |
| Start Time | Time when the job should run. |
| End Time | If applicable, the time by which the job should end. |
| Total Processed | Total number of records processed. If there are no new mappings added, there will probably be no records processed. |
| Message | Informational message, which varies according to the log type. |
While the job is being processed, you can view it from the Integration Queue workspace.
Viewing Data Integration History
The Integration History workspace shows all jobs, including canceled jobs.
1.Log into the Service Manager Application.
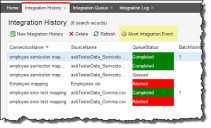
2.Open the Integration History workspace.
The list of import jobs appears. Also shown is the following information for each job:
| Field | Description |
|---|---|
|
Connection Name Source Name |
The name and source of the integration job as defined in About Configuring Data Integration. |
| Queue Status |
Indicates the status of the job. This field is color-coded. Queued: The job has not yet run but is in the queue. This status is replaced by running when the job begins. Running: The job is currently running. This status is replaced by completed when the job ends. Abort Requested: A user has canceled the job, but the cancellation has not yet taken place. This status is replaced by aborting as soon as the cancellation begins. Aborting: The job is in the cancel process. This realtime status only appears when the cancellation is running and is replaced by aborted when the cancellation is complete. Aborted: The job has been successfully canceled. This final status remains in the History workspace. Completed: The job has been successfully run. This final status remains in the History workspace. |
| Batch Number | The number of the last batch processed. A batch is 200 rows of data. |
| Batch Processed | The total number of rows that have been processed in the last batch. |
| Batch Failed | The total number of rows that have failed in the last batch. |
| Process Row Number | The total number of rows in all batches for the current job. If the job has 10 batches, for example, this field shows the total number of rows for all batches (2000). |
|
Batch Start Time Batch End Time |
The start and end time of the last batch processed. |
| Display Batch Time Taken | The number of seconds to run the last batch. |
| Start Time | The start time of the entire job. |
| Display Queue Running Time | The number of seconds to run the job, including initialization and dispatching. |
|
Created By Created On Modified By Modified On |
Automatically generated by the application based on the logged in user ID. |
Canceling a Running or Queued Job
You can only cancel a running or queued job.
1.Log into the Service Manager Application.
2.Open the Integration History workspace. A list of queued, current (running), and past jobs appear.
3.From the toolbar, click Abort Integration Event. The application adds the cancellation to the queue and the job status changes to abort requested. Usually this takes only a few seconds. You might need to refresh the screen to update the status.
Cancel Integration Job
When the cancellation process begins, the status changes to aborting. It usually takes less than a minute for a job to cancel, depending on the amount of data being processed.
When the cancellation is complete, the status changes to aborted. This status remains in the Integration History workspace.
Was this article useful?
Copyright © 2020, Ivanti. All rights reserved.

